Who Broke This Request?
- Distributed Systems
- Observability
- Gateways
I find 502 Bad Gateway a rather unhelpful error when I’m the person who has to investigate it.
As an API consumer, fine. Something between me and the service failed, and I probably cannot do much about it. But when I own the gateway, I want to know a bit more. Did we reach the service? Did we even get a connection? Did the service answer, and we failed while sending that answer back?
There is also a worse version of this problem: the request appears as 200 in the access log, but the client received half of the response body. Good luck finding that one on a graph of HTTP status codes.
I’ve been working on a small L7 gateway, called Outpost, for an experimental payment services platform. We have two data planes (aka relams), and one shared identity and access management service (IAM). The gateway checks credentials, selects the right realm, and forwards requests to private services. It is written in Kotlin, using Vert.x.
The routing requirement was fairly specific, which helped keep the service small. We compile the route table at startup, share HTTP clients where the receiver settings match, and stream bodies through. Payments and their business rules stay in the domain services.
What I want to write about here is how we record failures. It is easy to put a status code and a duration in a log. Deciding what those values actually tell us takes more thought.
What does “completed” mean?
Take a service that returns 500. Outpost receives the response, forwards it, and finishes. From the gateway’s point of view, all the HTTP work completed. From the client’s point of view, the operation failed.
Now take a service we cannot connect to. Outpost returns 502, and successfully finishes writing that error response. Again, the response completed. We still failed to make the service call.
I don’t want completed to mean “everything was fine”, because then I have to decide which of those two requests deserves the label. In our code it has a narrower meaning: the request ended through the normal completion path.
We keep the HTTP status, the lifecycle end, and the forwarding failure separately:
status=500 end=completed upstream_failure=none
status=502 end=completed upstream_failure=connect_failed
The first line means the service returned an error and we forwarded it. upstream_failure=none means we recorded no forwarding problem. It says nothing about whether the service did its job correctly.
The second line means we could not establish the service call. The gateway then completed its own error response. I would start investigating those two requests in different places, even though both contribute to the client’s error rate.
There are three lifecycle ends in RequestLifecycle: COMPLETED, DISCONNECTED, and DEADLINE. The last two are useful when no normal response can finish. If the caller leaves early, even the status stored in the response object does not prove that the caller received those headers.
That is the distinction I wanted to keep. Otherwise, every dashboard built on top of the logs has to guess what happened from the same incomplete number.
What we put in the log
The handlers publish their decisions into the Vert.x routing context as the request passes through. By the end, we can read the selected host set, route, rule, realm, lifecycle, forwarding failure, and whether connection acquisition was retried.
RequestLogHandler adds its end callback before it lets the request continue. This is deliberate: a request refused early still needs a record.
Here is an example in the format the handler writes. The duration and correlation ID are made up:
GET route=transactions /v1/transactions/{transactionId} host=api status=502 decision=forward rule=api/root:/v1/transactions/{transactionId} end=completed duration_ms=24 correlation_id=example upstream_failure=connect_failed upstream_retried=trueIt is a long line, but there are a few useful details in it. The route table selected the transactions route. Connection acquisition was retried and still failed. We returned 502.
One detail I would be careful with is decision=forward. It means we found a forwarding route. Authentication happens later and can still refuse the request. Seeing that field alone is no reason to tell the service team that we definitely sent them something.
The route label is also intentional. We write /v1/transactions/{transactionId}, rather than the path containing a customer’s transaction ID. The request log leaves out the query string, body, and credential headers too. I want to group requests by endpoint without collecting whatever happened to be in the URL.
This record has one total duration. We do not keep a timestamped history of every handler the request visited. So if the line says 900ms, it cannot tell me how much of that was authentication and how much was waiting for the service. For that investigation, I still need more than this log.
How much can we say about a failure?
The forwarding code records a ForwardingFailureKind. Some of the names are quite specific; others describe a fairly broad part of the exchange:
| Kind | What the forwarder observed |
|---|---|
pool_exhausted | The connection pool could not accept the acquisition |
connect_failed | Both connection acquisition attempts failed |
timeout | The send operation raised a timeout |
deadline_exceeded | The request ran out of time before response headers were sent |
write_failed | Sending failed after acquisition, outside the more specific cases |
response_truncated | Sending the response failed, or the streaming response limit was exceeded |
request_too_large | The request exceeded its body limit |
response_too_large | The declared response length exceeded its limit |
upgrade_refused | The caller requested a protocol upgrade |
The deadline handler also records response_truncated if time runs out after we have sent the headers.
I would like these fields to tell me exactly whose fault it was. In practice, they cannot always do that. A write_failed does not establish that the service reset a TCP connection. A response_truncated does not establish that the service crashed; the caller may have gone away while we were sending.
Giving those cases more confident names would make the logs look better without making them more accurate. I prefer to know which operation failed, then investigate the cause.
The retry flag helps here as well. Outpost allows one more connection acquisition attempt if the first fails and time remains. It sets upstream_retried=true when that second attempt starts. An exhausted pool is refused directly with 503.
A request that recovers can therefore finish like this:
status=200 upstream_failure=none upstream_retried=trueI still want to see that retry, even though the caller got a good response. And I want it kept separate from retries of the actual request, which Outpost does not do once sending starts. For a payment, the service could have committed the operation before the response disappeared. Replaying it is a decision for the domain’s idempotency rules, not the gateway’s HTTP client.
The 200 OK that did not finish
This is the case I find easiest to overlook when reading access logs.
Suppose a service sends 200 OK and starts sending its body. Outpost forwards the headers immediately, then streams the body as it arrives. Halfway through, the request deadline expires.
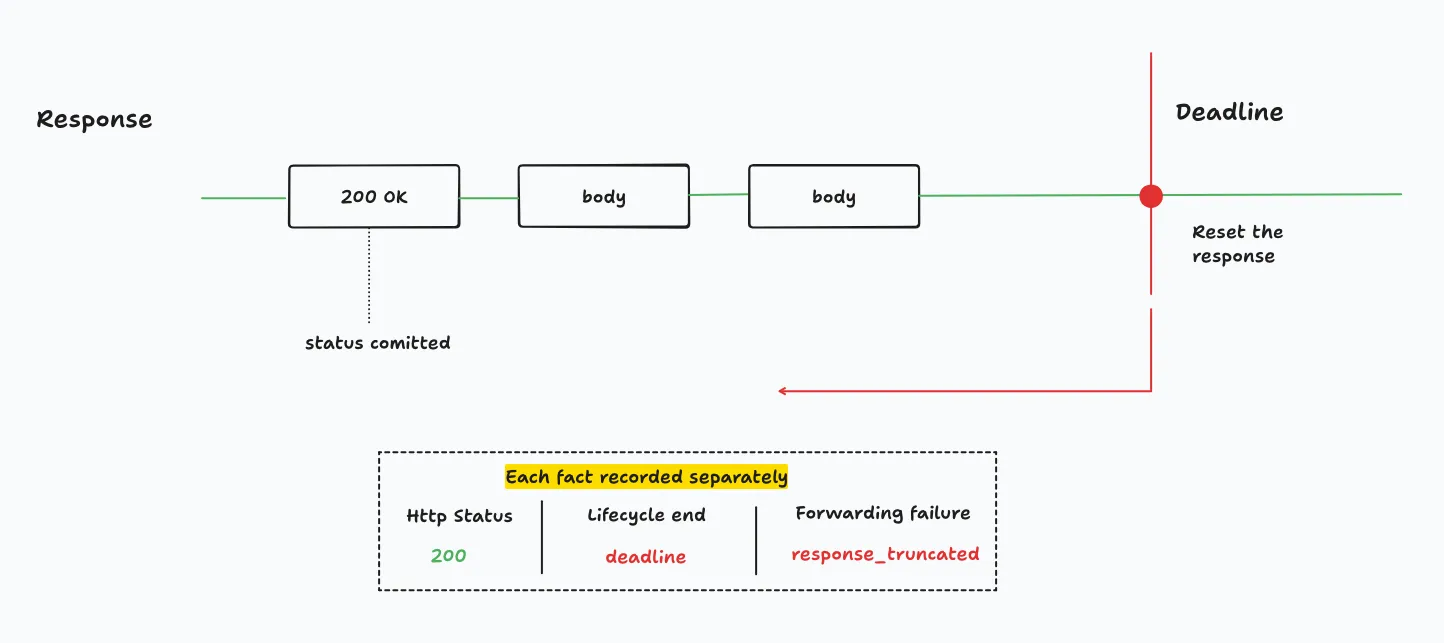
At this point, what should we send the client?
The 200 has already gone out. We cannot replace it with 504. Writing our usual JSON error after the partial body would just give the client a broken response with some unrelated JSON at the end. So the deadline handler resets the response and records the truncation:
status=200 end=deadline upstream_failure=response_truncatedIf I only count status classes, this goes into 2xx. That is how a gateway can have a healthy-looking graph while callers are failing to read responses.
There is a similar distinction with body size limits. If the service declares a response length above our limit, we can refuse it before sending the headers. That gives us response_too_large and a 502. If the length is unknown and we discover the problem while streaming, the headers may already be sent. Then we record a truncation and reset the upstream request.
Same size policy, different failure record, because we found out at a different point in the response.
There are a couple of limitations in our logging worth keeping in mind. The request end callback reads the failure field when it runs; an asynchronous failure can be recorded later. Also, request lines below status 400 use debug level. A truncated 200 can have its access log line hidden at an info threshold. The explicit error logs in the deadline and forwarding handlers are therefore necessary. I would not rely on the access log alone for this case.
When callbacks disagree
Once a request starts failing, several callbacks can report it. The deadline fires, the client response ends, and the outbound operation reports an error because we cancelled it.
I want to keep the original lifecycle end through all of that. RequestLifecycle.close uses compare-and-set:
fun close(end: End): Boolean = ended.compareAndSet(null, end)Only the first transition succeeds. If the deadline won, successfully writing the 504 afterwards cannot change the end to completed. If a failed end callback won first, the end is disconnected, and the timer cannot replace it.
The name disconnected is our label for a failed Vert.x end result. It does not tell us why the connection went away.
The forwarder also checks whether the request is still open before recording send failures. If we already ended it, the forwarder resets the outbound request and stops. Otherwise, we could end up reporting the errors caused by our own cancellation as fresh service failures.
One thing our code does not preserve this way is the first forwarding failure. That field is writable, and a later record can replace it. The lifecycle has one terminal transition; the failure field holds the current diagnostic detail. I mention this because it would be easy to read more history into that field than we actually store.
Keeping this cheap
For a small gateway, I don’t want recording the request to become a large part of processing it.
RequestMeters binds the counters and timers at startup. During a matched request, we select them by route index, realm, and status class. Metric tags use configured values such as service and group. Transaction IDs and raw paths never become labels.
There are separate counters for forwarding failures, tagged by kind and service, and for deadline and disconnect events. They count different observations. A deadline can interrupt a response send, so I cannot add the two counters together and call that the number of failed requests. Ordinary status counters are still needed for service errors that we forwarded successfully.
This is about as much as I want the gateway to claim. When I look at a failed request, I should be able to tell whether we reached a service, which part of forwarding failed, and whether we ran out of time. I can still be wrong about the cause. At least I have somewhere useful to start looking.